2024 E-Insights Report
Income Inequality (GINI Index)
Income Inequality (GINI Index)

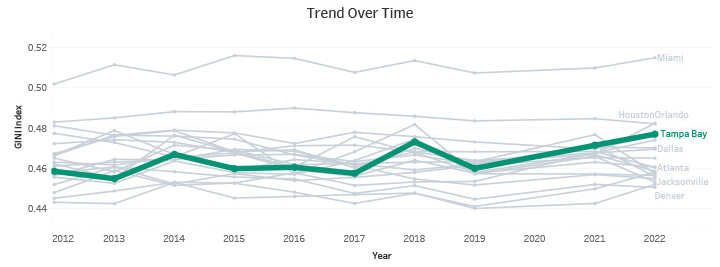
Trend Over Time
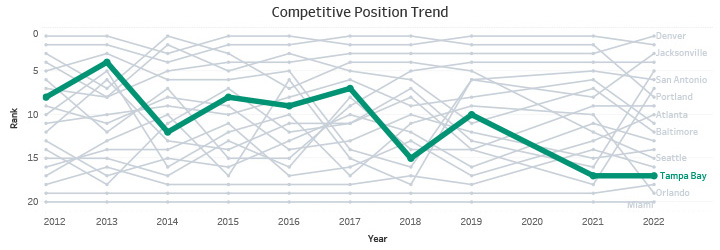
Competitive Position Trend
About: Income inequality measured by the Gini index, ranges from 0 to 1, refers to the extent
income is distributed in an uneven manner among the population. A Gini index of 0
implies perfect income equality, i.e., every individual receives equal share. A Gini
index of value 1 indicates perfect income inequality, implying that only one individual
receives all the income.
Source: U.S. Census Bureau, American Community Survey.
- Most of the MSAs Gini Index has seen a constant trend over time. Minneapolis and Miami maintained higher and lower competitive position in income inequality respectively.
- The Gini Index in Tampa Bay has an increasing trend and decreasing competitive rank over the years, indicating that inequality is rising.