2024 E-Insights Report
Standardized Medicare Spending per Capita
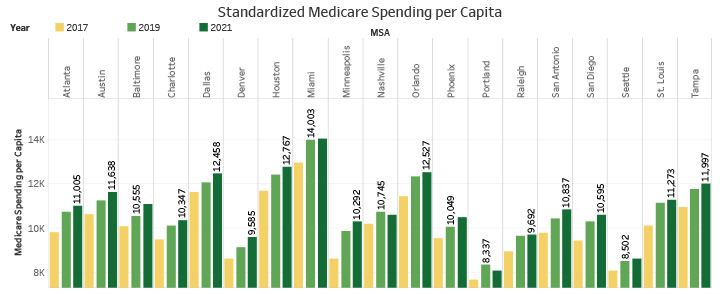
Standardized Medicare Spending per Capita
Trend Over Time

Competitive Position Trend

About: Measures the average amount of money spent on each Medicare beneficiary in a given
year, adjusted for differences in health status and demographics.
Source: Centers for Medicare and Medicaid Services. [Dataset: Medicare Geographic Variation
Public Use File].
- The Medicare spending per capita for the Tampa Bay region has increased over the years, except for 2016 and 2020.
- All MSAs experienced less Medicare spending for 2020.
- Tampa Bay rose to the 5th position in 2010 and kept its position until 2021. Miami and Portland consistently held the top and the bottom position respectively.