2024 E-Insights Report
Black-White Poverty Gap
Black-White Poverty Gap
Black-White Poverty Gap Trend

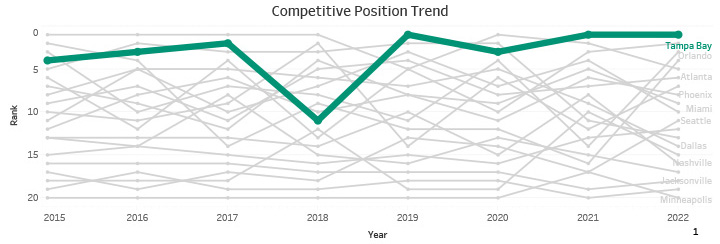
Competitive Position Trend
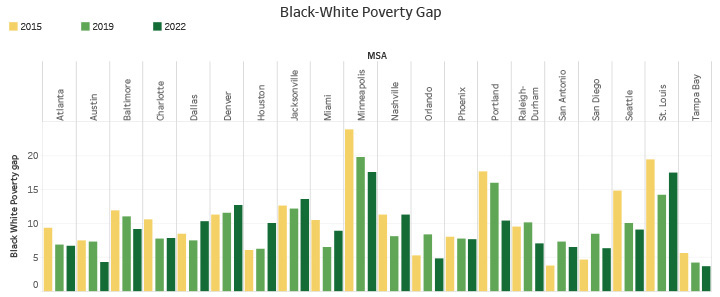
About: Quantifies the disparity between Black and white workers employed full-time with
incomes below the poverty line. Calculated by taking the difference between the average
poverty rates of Black and white Americans within the MSA.
Source: U.S. Census Bureau, American Community Survey, Table S1701.
- The Black-white poverty gap has been decreasing in most MSAs. As of 2022, Minneapolis has the highest Black-white rate gap among all the MSAs.
- Tampa Bay emerges as a consistent performer, ranking in the top 5 position for most of the years and achieving the lowest poverty gap in 2021 and 2022.