2024 E-Insights Report
STEM Degree Enrollment
STEM Degree Enrollment per 10,000 Residents

Trend Over Time

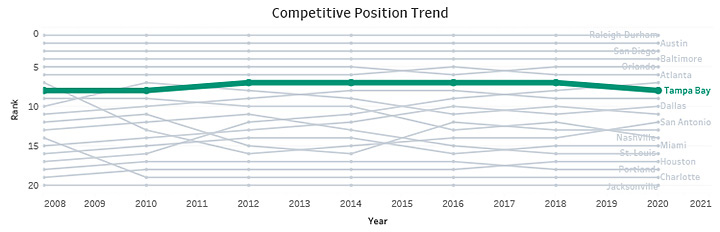
Competitive Position Trend
About: Number of individuals graduating with degrees in science, technology, engineering
and mathematics (STEM degrees) per 10,000 residents.
Source: Integrated Postsecondary Education Data System.
- Tampa Bay produced the least STEM degrees in 2006 with almost 32 degrees per 10k residents but gradually saw a slight improvement and reached its maximum in 2016 at around 50 degrees per 10K residents. In terms of competitive positioning, Tampa Bay experienced a positive trend, climbing the ranks by four positions from No. 12 in 2006 to No. 8 in 2020.
- For all the years, Seattle produced the most STEM degrees, whereas Jacksonville produced the fewest.