2025 E-Insights Report
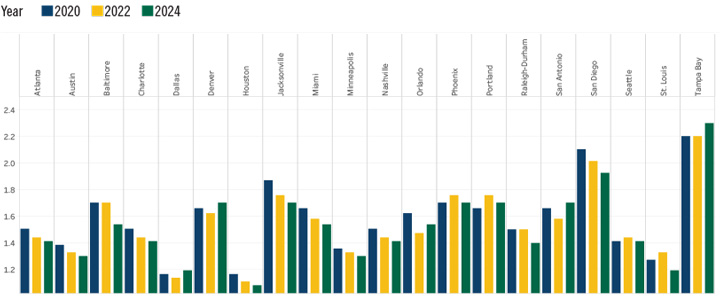
Household Debt-To-Income Ratio
- Since 2019, Tampa Bay has consistently ranked last among all MSAs for the worst performance in managing household debt. The debt ratio slightly increased from 1.5 in 2000 to 2.3 in 2024, indicating persistent challenges. The rank has remained at the bottom, indicating continued burden for household debt.
- In 2024, Houston emerged as the best-performing MSA for household debt ratio, reflecting strong financial management and lower debt burdens for households. Conversely, San Diego, with a debt ratio of 1.925, ranked 19th, indicating that it struggled with higher household debt levels, possibly due to cost-of-living challenges or economic pressures.
Trend Over Time
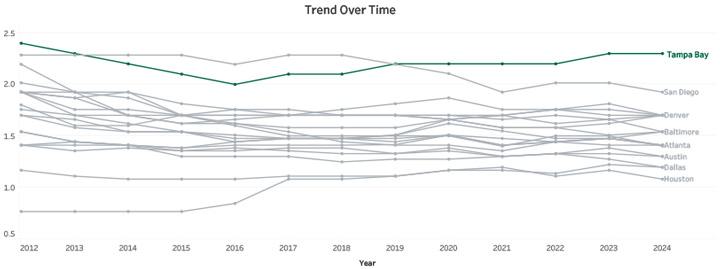
Competitive Position Trend
Measures the ratio of household debt arising from loans to the gross disposable income
earned by the individuals in that household.
Source: Board of Governors of the Federal Reserve System - Household Debt.