2025 E-Insights Report
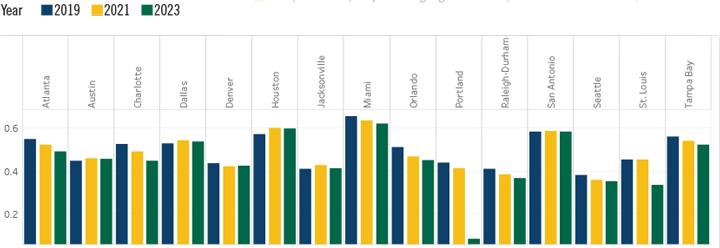
Children Eligible for Free or Reduced Price Lunch
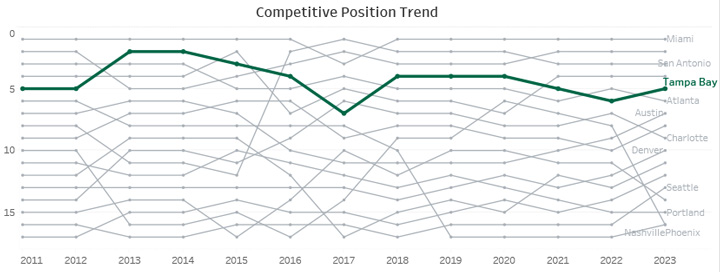
- Tampa Bay consistently held a competitive position over time, maintaining its rank within the top six across most years. This indicates steady performance relative to other MSAs, although some fluctuations occurred, especially around 2017, where its rank briefly dropped to seven before stabilizing back to five in recent years.
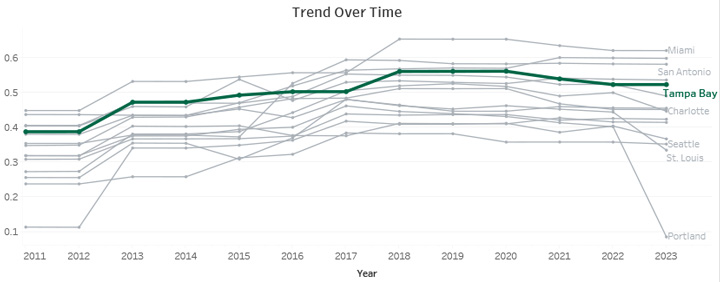
- Comparing other MSAs like Miami and San Antonio, Miami remained a dominant leader, holding the first position across all years. San Antonio showed a strong upward trajectory, climbing into top positions (ranks first through third) post-2016, emphasizing significant improvements in relative performance.
Trend Over Time
Competitive Position Trend
This indicator tracks the percentage of children eligible for free or reduced-price lunch programs across various Metropolitan Statistical Areas (MSAs) on a yearly basis. Source: County Health Rankings & Roadmaps Due to data limitations, only 15 MSAs have been included in the analysis.