2025 E-Insights Report
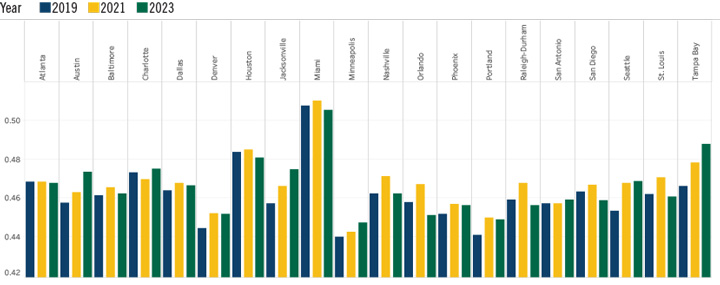
Income Inequality Gini Index
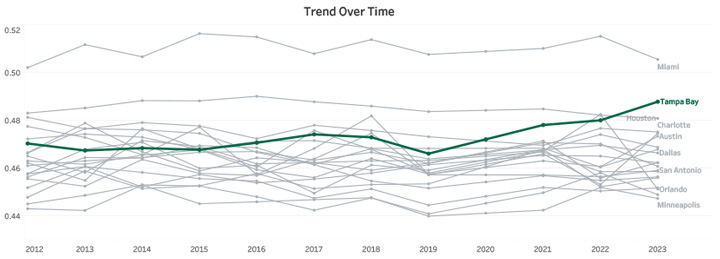
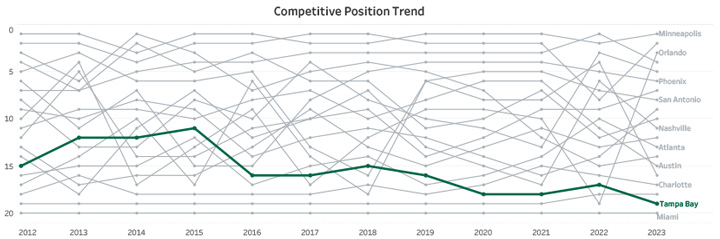
- Tampa Bay’s Gini index has shown a gradual increase over the years, rising from 0.470 in 2012 to 0.488 in 2023. Its ranking has declined from 12th in 2013 to 19th in 2023, reflecting worsening income inequality. This trend suggests growing disparities in income distribution within the region.
- In 2023, Minneapolis achieved the lowest Gini index of 0.4474, indicating the most equitable income distribution among the MSAs. Conversely, Miami recorded the highest Gini index, highlighting significant income inequality.
Trend Over Time
Competitive Position Trend
Income inequality measured by Gini index, ranges from 0 to 1, refers to the extent income is disributed in an uneven manner among the population. Gini index of 0 implies perfect income equality, i.e., every individual receives equal share. Gini index of value 1 indicates perfect income inequality, impling that only one individual receives all the income. Source: U.S. Census Bureau, American Community Survey.