2025 E-Insights Report
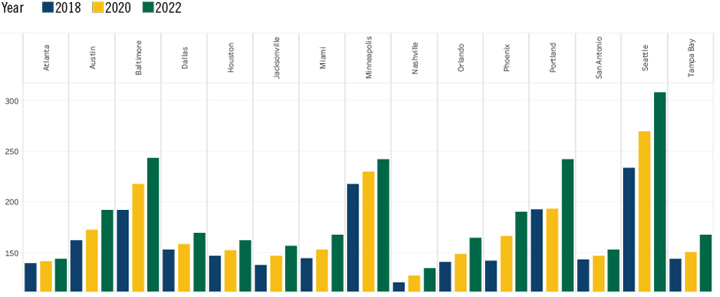
Child Care Costs
- Tampa Bay’s child care costs have shown a steady increase, rising from $133.06 in 2015 to $167.79 in 2022. Despite this growth, its ranking has fluctuated between fifth and eighth, indicating moderate competitiveness in child care affordability. This trend suggests that while costs are increasing, Tampa Bay remains relatively accessible compared to other MSAs.
- In 2022, Nashville emerged as the most affordable MSA for child care, highlighting better affordability and access. Conversely, Seattle, with the highest average cost of $307.82 (ranked 15th), reflects significant financial challenges for families, likely due to high living expenses and limited affordable child care options.
Trend Over Time
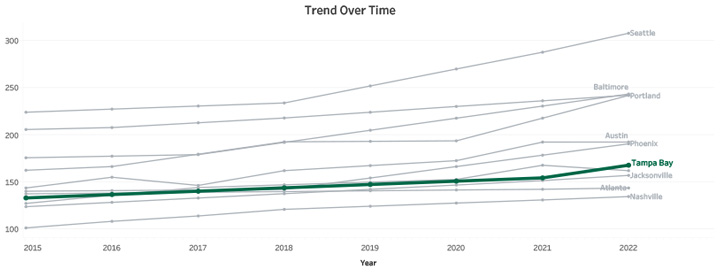
Competitive Position Trend
The child care cost indicator represents the weekly, full-time median price of child care services, segmented by age group (infant, toddler and preschool) and provider type (center-based and family child care). These costs are calculated and averaged at the county level for the years 2015–2022, providing insights into child are affordability and trends over time. Source: U.S. Department of Labor. National Database of Child Care Prices (NDCP).