2025 E-Insights Report
Private Housing Structure Building Permits
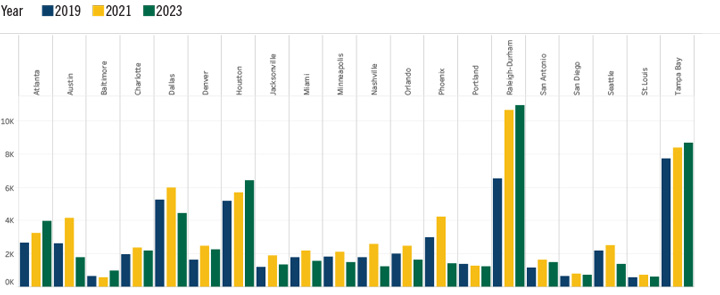
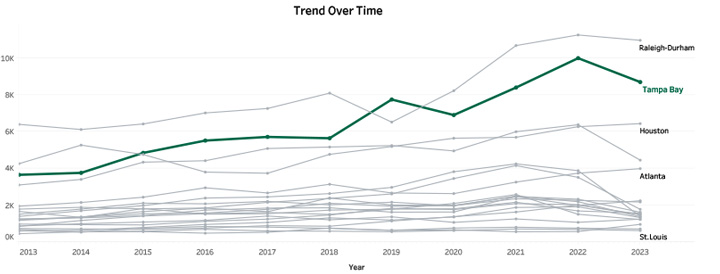
- Raleigh-Durham and Tampa Bay consistently exhibit the highest housing authorization rates, indicating that these MSA have experienced significant growth in housing demand and construction activity. Conversely, St. Louis and San Diego appear to have comparatively lower authorization rates.
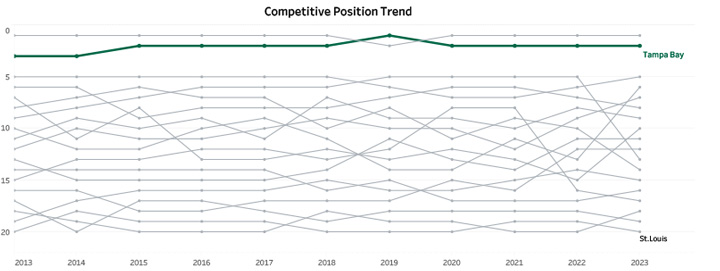
- The trend for Tampa Bay demonstrates a steady upward trajectory over the past decade, achieving a first place ranking in 2019 compared to other regions.

Trend Over Time

Competitive Position Trend

This indicator represents the total number of building permits for all structure types,
including 1-unit, 2-unit,3-unit,4-unit,5-unit in each MSA.
Sources: U.S.Census Bureau, New Private Housing Structures Authorized by Building
Permits, Retrieved from FRED, Federal Reserve Bank of St. Louis.