2025 E-Insights Report
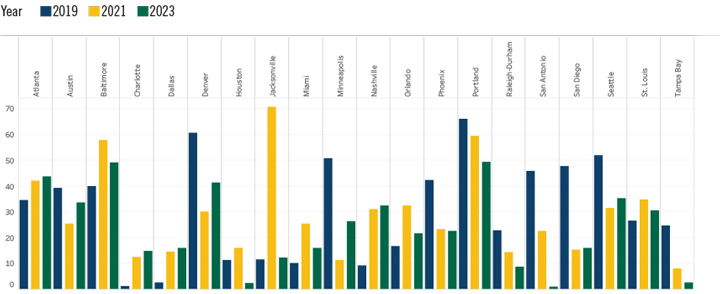
Black-White Public Transportation Rate Gap
- Portland and Jacksonville exhibit the highest Black-White public transportation rate gaps, indicating significant disparities over the years.
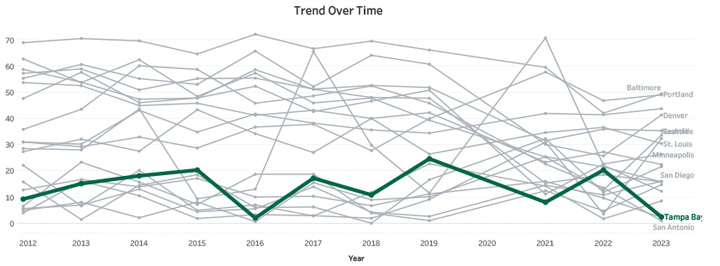
- Tampa Bay shows a relatively moderate gap that fluctuates over time but has shown improvement in recent years.
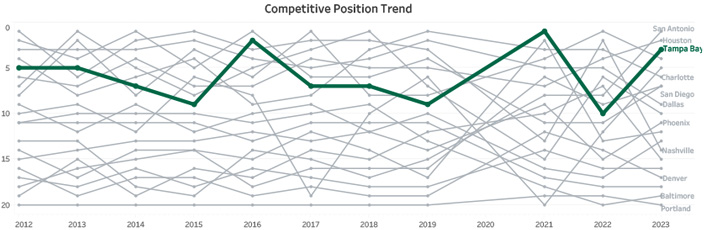
- By 2023, Tampa Bay ranks third in a competitive position, reflecting notable progress in narrowing the gap compared to other MSAs.
Trend Over Time
Competitive Position Trend
Measures the black-white gap in percent of the population who are using public transportation
as their means of transportation. It is calculated by subtracting the the percentage
of African-American workers using public transportation from that of white American
workers in each MSA.
Source: Census Bureau, American Community Survey, table S0802.