2025 E-Insights Report
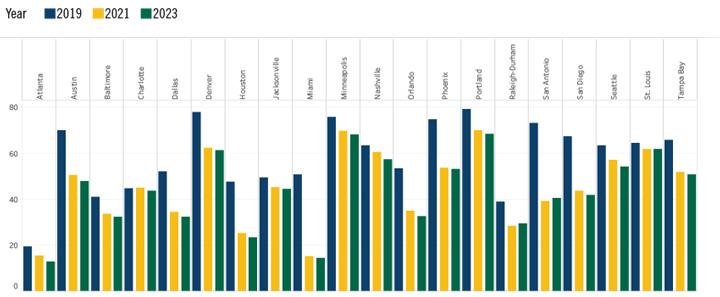
Black-White Car Transportation Rate Gap
- Portland exhibits the highest Black-White car transportation rate gap over the years, followed by Denver and Phoenix.
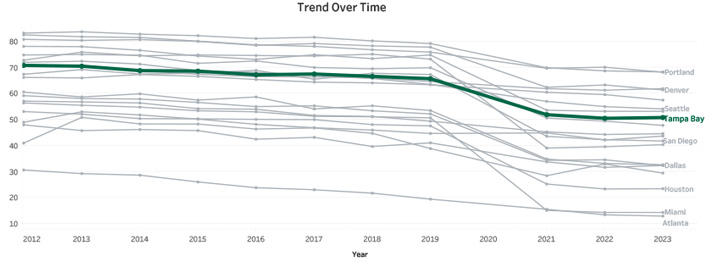
- Tampa Bay shows a moderate gap that has gradually declined over the years, reflecting steady improvement.
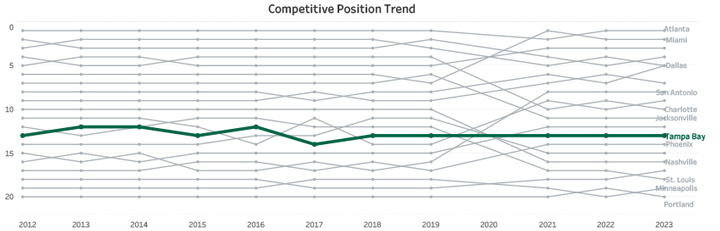
- Tampa Bay ranks 13th in the competitive position trend, maintaining a middle-tier position compared to high-gap MSAs like Portland.
Trend Over Time
Competitive Position Trend
Measures the black-white gap in percent of the population who are using car as their
means of transportation. It is calculated by subtracting the percentage of African-American
workers using a car as the primary means of transportation from that of white American
workers in each MSA.
Source: Census Bureau, American Community Survey, table S0802.