2025 E-Insights Report
Marginal Regional Price Parities Cost of Utilities Index
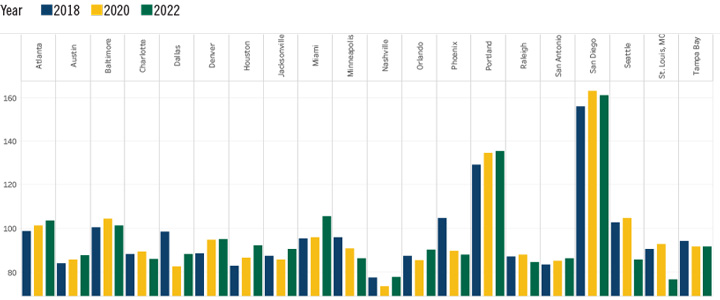
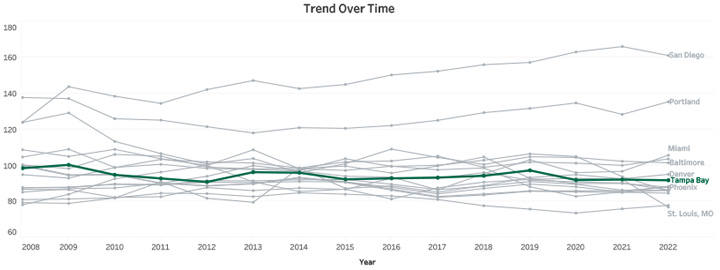
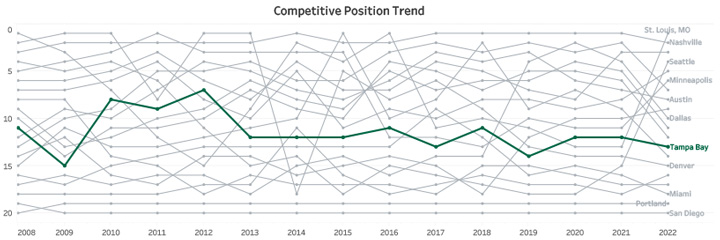
- Tampa Bay’s utility costs have shown minor fluctuations over the years, decreasing slightly from 98.42 in 2008 to 91.70 in 2022. Its rank has ranged between seventh and 15th, indicating moderate competitiveness in utility affordability. This suggests a relatively stable environment for household utility costs compared to other regions.
- St. Louis had the most affordable utility costs in 2022 with a value of 76.78, highlighting efficient utility management. In contrast, San Diego faced the highest utility costs at 161.07, reflecting significant affordability challenges.
Trend Over Time
Competitive Position Trend
Cost of Utilities (Regional Price Parities) - Household utilities consist of water
supply and sanitation and electricity and gas.
Source: U.S. Bureau of Economic Analysis, “MARPP Regional price parities by MSA.